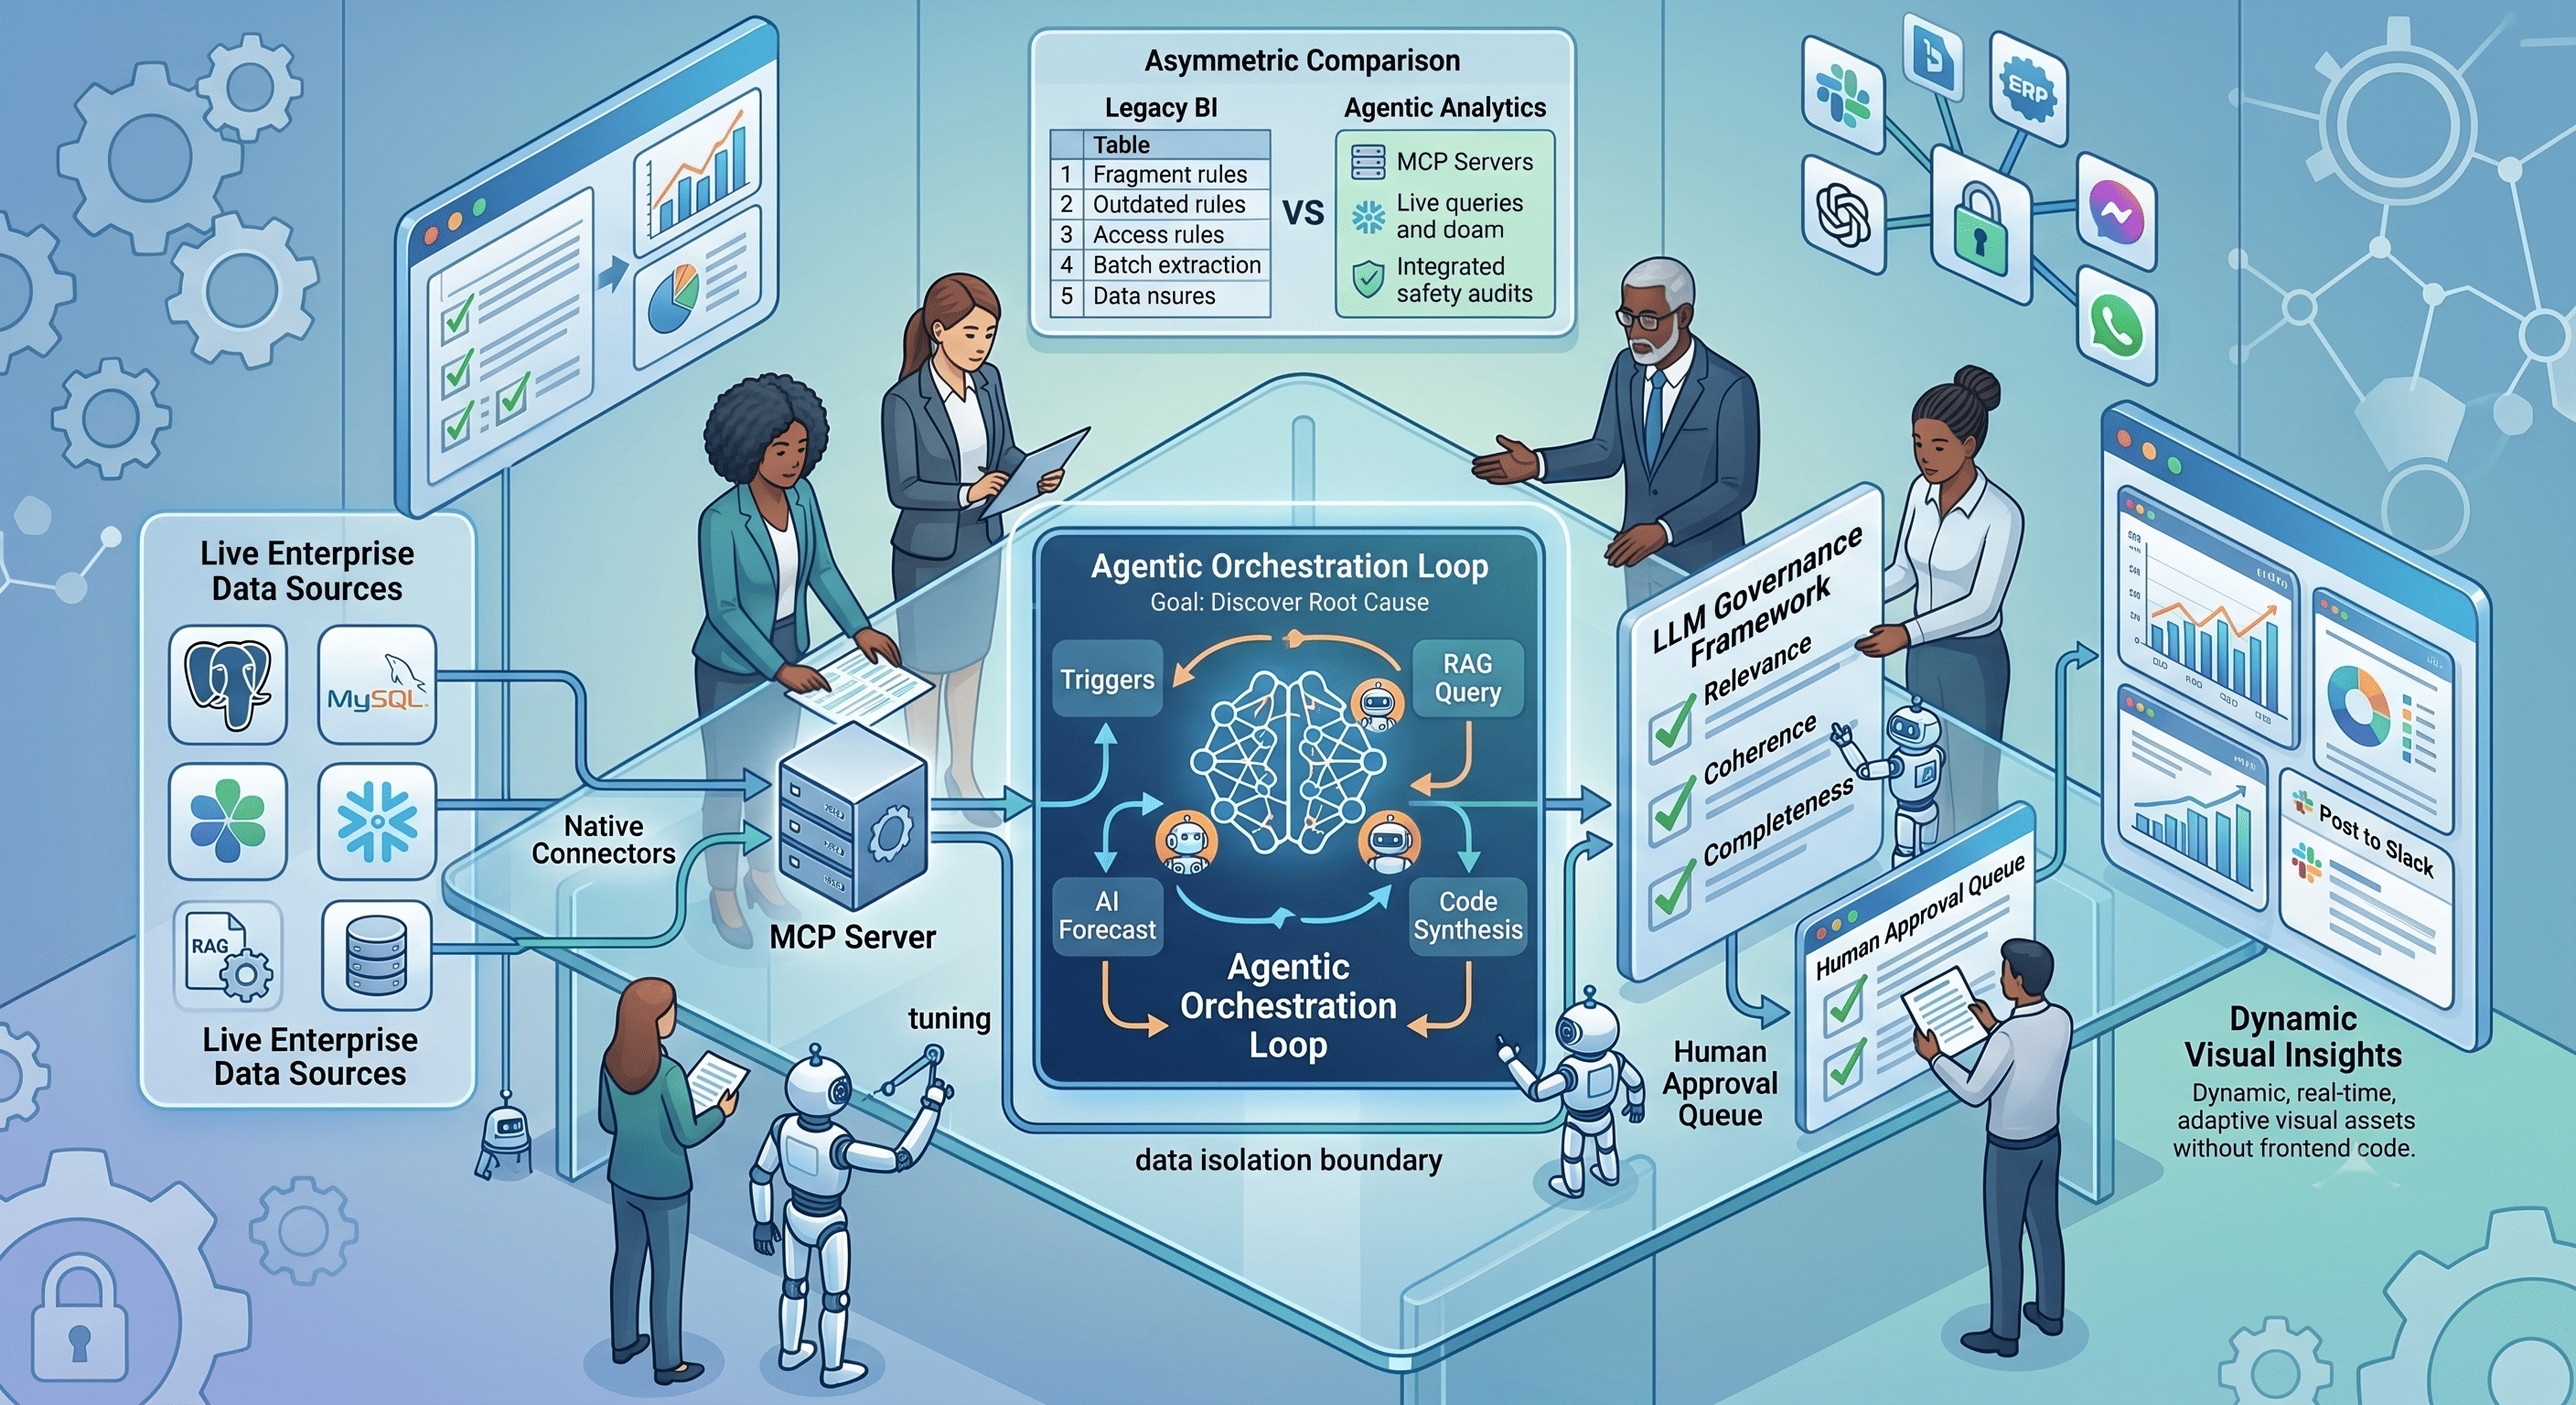
The Evolution of Data BI: Moving from Static Dashboards to Agentic AI Visual Analytics
Key Takeaways
The Shift to Autonomy: Traditional BI platforms limit organizations to passive data review, whereas agentic AI visual analytics transitions systems into proactive, decision-making partners.
Orchestration Over Coding: Enterprise architectures are replacing manual data pipelining with visual, zero-code workflows that connect directly to live data environments.
Governed Agility: Scaling agentic data operations requires built-in, automated evaluation metrics and human-in-the-loop validation to ensure enterprise-grade reliability.
Agentic AI visual analytics represents the paradigm shift from passive data visualization to autonomous, closed-loop data reasoning and execution. Data engineering benchmarks confirm that integrating autonomous software agents into business intelligence workflows eliminates manual dashboard design by enabling systems to independently query data, discover structural trends, and dynamically generate visual assets. By marrying generative capabilities with granular organizational data sources, agentic visual analytics transforms raw corporate repositories into secure, real-time engines of execution.
The Structural Limits of Legacy Business Intelligence
For over two decades, corporate data initiatives have relied on centralized data repositories paired with downstream dashboard layers. While functional for historical reporting, this architecture introduces systematic friction into modern enterprise operations.
Data engineers spend a disproportionate percentage of their operating hours drafting extraction logic, managing complex semantic transformations, and manual layout adjustments. When a business stakeholder encounters an anomaly on a chart, the system cannot investigate the root cause independently. Instead, it triggers a recursive chain of manual database requests, slowing down organizational velocity.
Why Traditional BI Platforms fall short in 2026
Traditional drag-and-drop dashboard builders and legacy semantic layers fail to address the core problem of modern business: data velocity. These platforms are fundamentally rigid, relying on pre-computed aggregations that require constant developer maintenance.
When underlying schema modifications occur or unexpected operational questions arise, legacy platforms break, requiring manual code overrides and layout redesigns. Conversely, autonomous agents eliminate the manual work of constantly rebuilding charts by decoupling data retrieval from rigid presentation layers. By utilizing dynamic reasoning loops, an agentic AI analytics framework intercepts the raw user query, synthesizes the necessary schema logic, pulls the data directly, and designs the optimal visualization layout programmatically—without requiring a single line of frontend code.
The Architecture of Agentic AI Visual Analytics
True agentic visual analytics operates via a decoupled, multi-layered architecture focused on live connectivity, automated orchestration, and enterprise guardrails. Rather than storing and rendering static visual arrays, next-generation spaces deploy goal-driven software components capable of coordinating complex analytics tasks across disconnected systems.
1. Unified Data Aggregation: Native Connectors and MCP Servers
A major bottleneck for traditional intelligent visual analytics setups is the brittle nature of third-party API configurations. WPIntelliChat addresses this structural issue through an integrated Data Hub featuring native, production-grade multi-database connectors. Organizations can establish secure, direct linkages to structured systems like PostgreSQL, MySQL, and Snowflake, or manage unstructured corporate knowledge bases through dedicated Retrieval-Augmented Generation (RAG) collections.
Beyond traditional database integrations, the application utilizes Model Context Protocol (MCP) servers to handle connections with external software ecosystems. By implementing MCP infrastructure, your custom-built analytical agents are not confined to isolated read-only operations. They possess the contextual capabilities to securely read schema definitions, bridge data fragments between separate environments, and interface with third-party web services while completely preserving data isolation boundaries.
2. Visually Guided Automation Pipelines
Moving away from complex scripts, modern data orchestration is performed inside a visual workflow canvas. Developers and analysts build end-to-end processing pipelines using functional, modular execution nodes.
Triggers: Workflows can be initiated based on distinct parameters, such as a manual file upload event, a cron-based schedule, or a automated system threshold alert.
Semantic Retrieval: When an active trigger fires, the pipeline can route data into a RAG Query node to pull contextual company guidelines or internal knowledge repositories.
Advanced Analytics: The pipeline can pass these enriched records into analytical blocks like Ask AI or automated predictive Forecast nodes to compute complex data trends.
Visual Synthesis & Notification: Once processed, the agent automatically structures the findings via a Generate Dashboard or Generate Report block before executing downstream web hooks—such as pushing interactive visualizations directly to external communication interfaces via a Post to Slack or Send Email node.
Technical Architecture Note: By encapsulating the entire data journey into a visually deterministic directed acyclic graph (DAG), engineering leaders achieve total structural transparency. If an enterprise data source undergoes an external change, individual node configurations can be adjusted instantly without breaking downstream business logic.
Drive Velocity with Zero Code
Stop writing brittle orchestration code and complex scripts to glue databases to LLMs. Sign up for WPIntelliChat to visually automate your data analytics pipeline in minutes.
Asymmetric Comparison: Legacy BI vs. WPIntelliChat Agentic AI
Implementing Enterprise-Grade Safety in Autonomous Systems
Giving AI agents direct access to data systems requires strong safety guardrails. Without real-time compliance monitoring, automated pipelines risk introducing logical anomalies or data leakage into downstream business decisions.
To counter these operational risks, WPIntelliChat runs an integrated, enterprise-ready LLM Governance framework directly alongside its execution engine. Every prompt configuration and agent action runs through a multi-tiered safety system before deployment:
Step-by-Step Governance Workflow
Automated Evaluation Evaluation: When an agent structures a data query, the platform calculates automated real-time metrics, evaluating parameters like semantic relevance, contextual coherence, and prompt completeness.
Deterministic Threshold Rules: If a generation falls below specified compliance standards, the transaction is flagged and halted, protecting downstream pipelines from bad data.
Human-in-the-Loop Approval: Prompts and agent profiles are routed directly to a centralized Human Approval Queue. Administrative teams can inspect the execution telemetry, audit the resource consumption metrics, and verify correctness before promoting the model asset to active production environments.
This strict structure allows organizations to scale visual analytics automation safely, preserving compliance boundaries while empowering non-technical business teams to generate secure data insights on demand.
Leading the Next Generation of Corporate Analytics
The transition from rigid, manual dashboard development to agentic AI analytics is a major operational milestone for modern software architectures. By replacing old-fashioned development pipelines with autonomous reasoning agents, corporations can cut operational bottlenecks, reduce technical overhead, and accelerate time-to-insight from days to seconds.
WPIntelliChat combines native database connectivity, visual workflow orchestration, and strict corporate compliance features into a single, unified enterprise workspace.
Ready to modernize your business intelligence architecture? Create your free account today to visually orchestrate your first autonomous data agent, or connect with our product engineering group to coordinate a private enterprise governance demonstration.