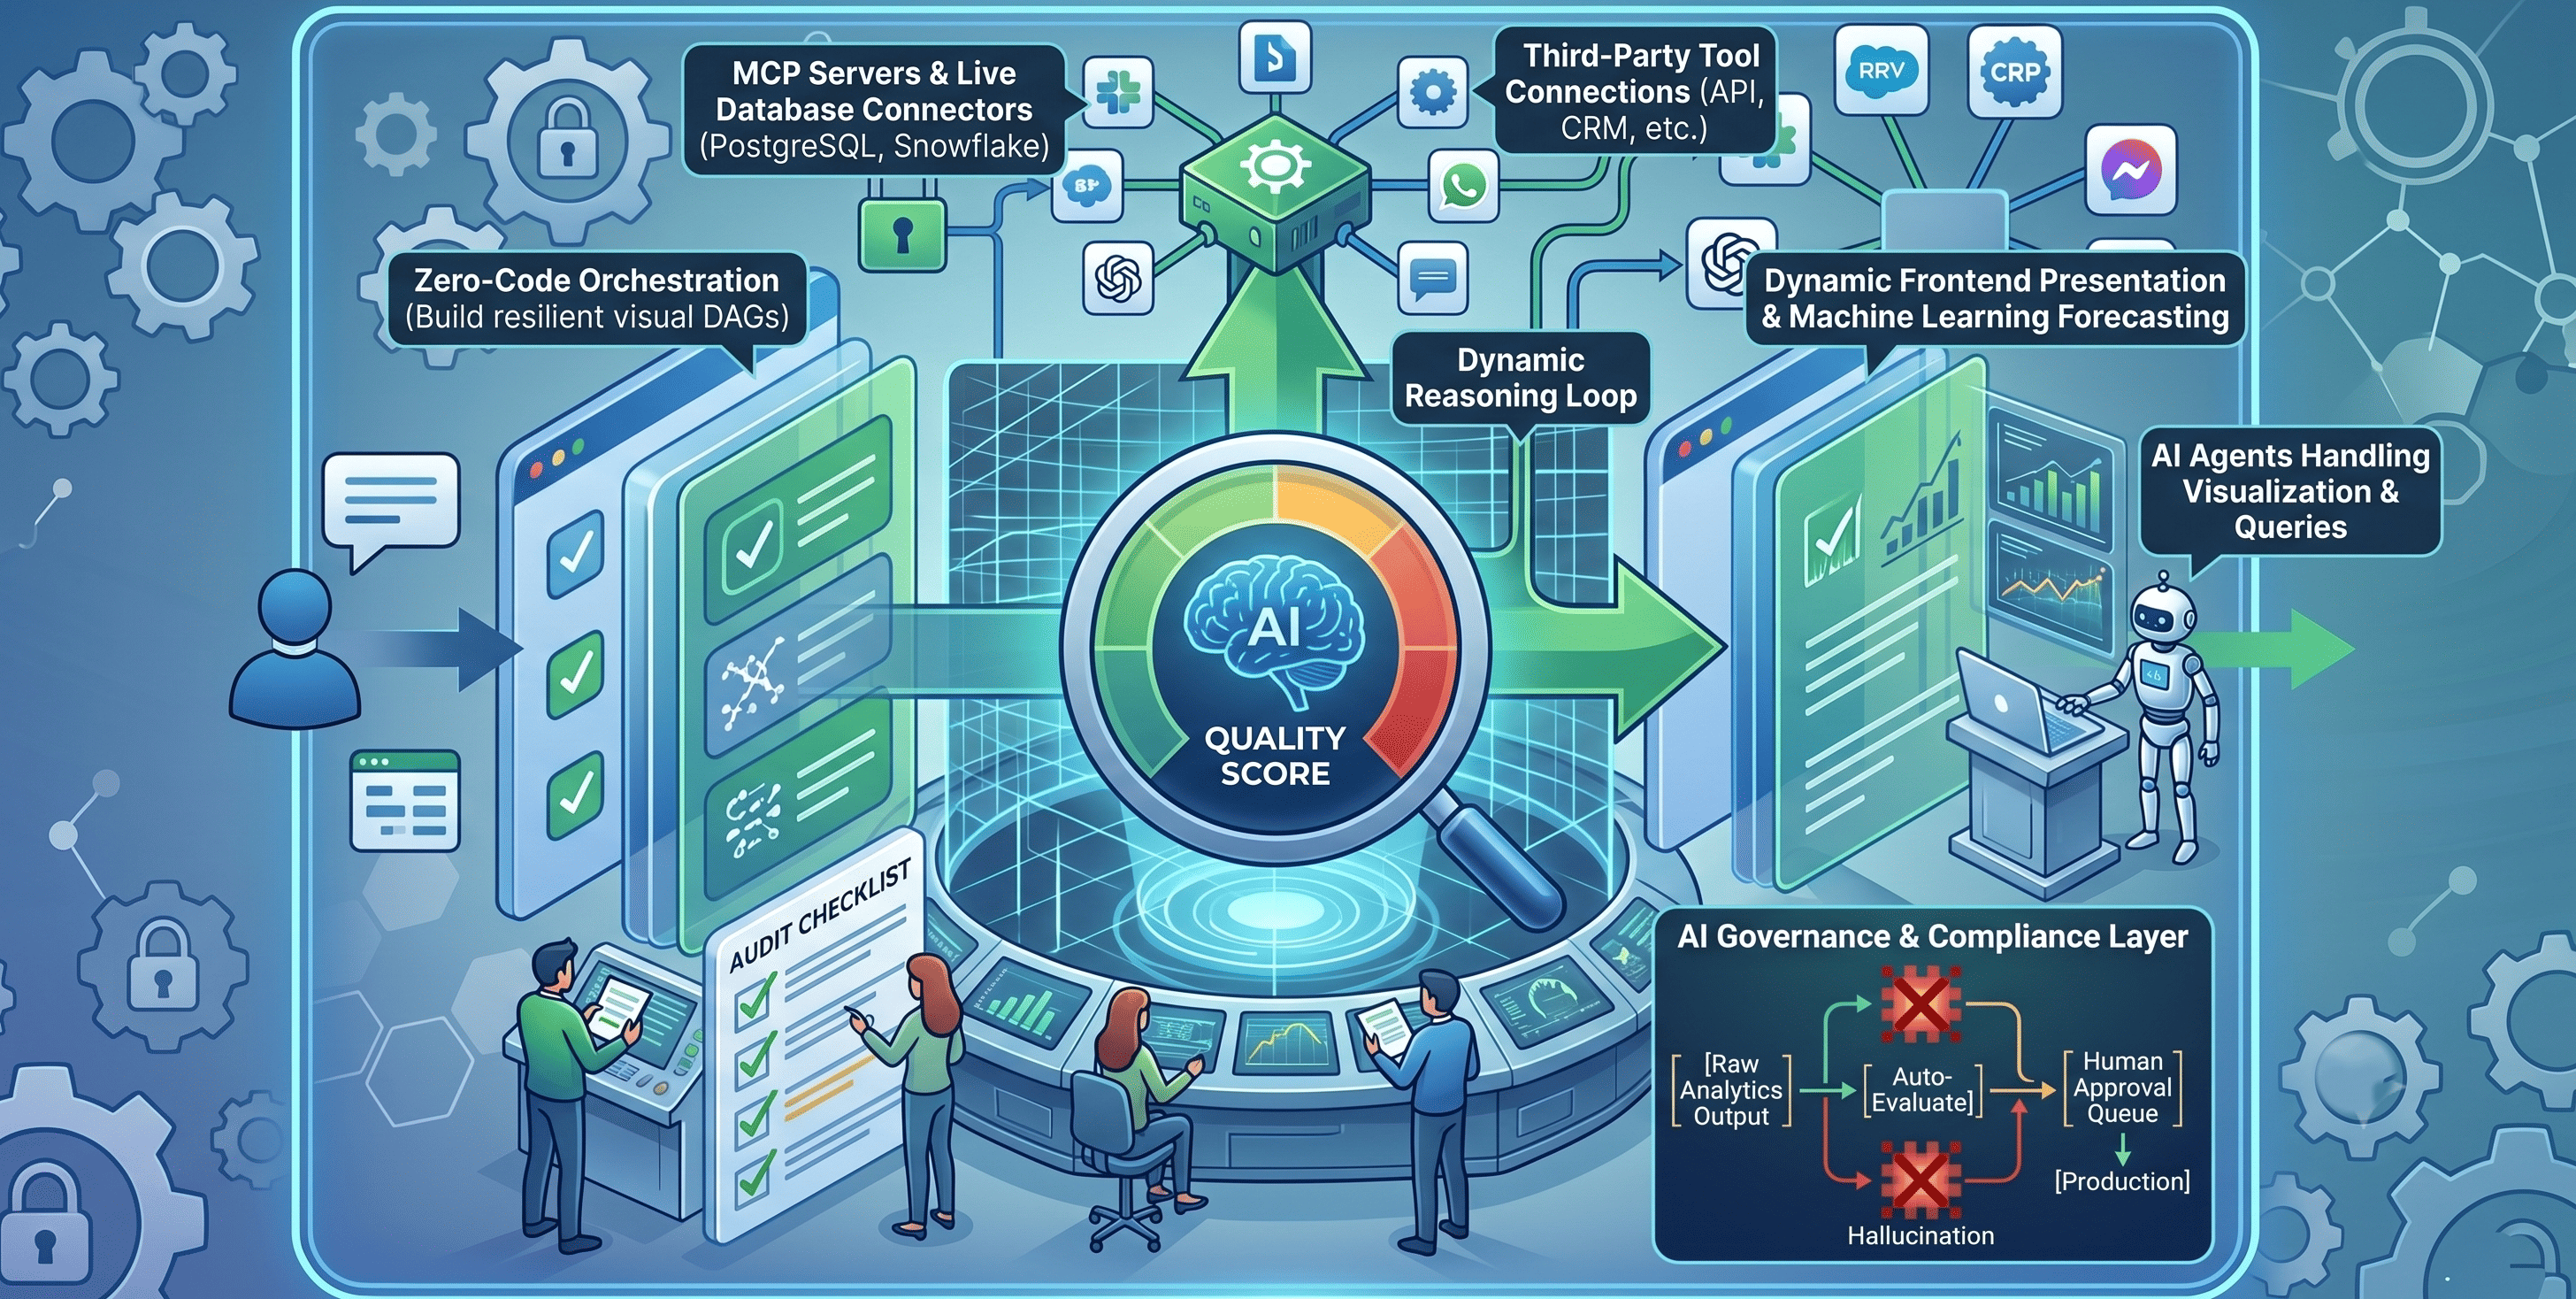
Autonomous Data Analytics: Replacing Brittle Data Pipelines with Intelligent Visual Analytics
Key Takeaways
Pipeline Fragility Eliminated: Traditional analytics depend on rigid ETL/ELT pipelines that break during schema updates, whereas autonomous data analytics decouples data engineering from presentation layers through dynamic reasoning loops.
Zero-Code Orchestration: Enterprise data architecture is shifting away from manual coding and complex scripts toward visual canvas workflows that handle data ingestion, semantic enrichment, and visualization natively.
Unified Intelligence Stack: Modern analytics platforms converge live database connectivity, Model Context Protocol (MCP) server support, and automated machine learning forecasting into a single, cohesive engine.
Autonomous data analytics is the automated orchestration of data engineering, semantic processing, and business intelligence execution by goal-driven AI agents without human intervention. Enterprise data performance metrics confirm that replacing manual pipeline development with autonomous software loops reduces operational latency and eliminates the structural brittle points common to legacy data architectures. By natively coordinating structured database queries, vector-based retrieval, and real-time visualization frameworks, autonomous data analytics allows modern enterprises to instantly transform raw information into interactive, predictive assets.
The Hidden Tax of Brittle Data Pipelines: Why Legacy BI Fails
Modern enterprise data teams operate under a continuous backlog of broken data pipelines, schema mismatches, and outdated dashboards. Traditional business intelligence frameworks rely heavily on rigid, multi-stage ETL/ELT pipelines where a single upstream structural change—such as a modified column name in a PostgreSQL database or an altered data type in Snowflake—causes a cascade of downstream failures.
When these structural breaks occur, data engineers must manually diagnose the error log, adjust the orchestration code, rebuild the semantic abstractions, and redesign the frontend charts. This manual lifecycle introduces significant operational drag, forcing organizations to consume data that is hours or days old.
The Breakdown of Traditional Dashboard Engineering
Legacy tools—ranging from static drag-and-drop report builders to traditional cloud-based visualization layers—treat data processing and asset display as disconnected layers. This architectural separation requires continuous development resources to maintain basic functionality.
Because traditional platforms lack semantic reasoning capabilities, they cannot dynamically adapt when data schemas change or when business stakeholders introduce novel operational questions. As a result, companies are trapped in a cycle of building hyper-specific, hard-coded dashboards for single use cases, cluttering the data warehouse and expanding technical debt.
Transitioning to Intelligent Visual Analytics: A Live Walkthrough
To eliminate pipeline vulnerability, modern software architectures leverage an integrated, execution-driven ecosystem. Rather than writing long scripts to connect databases to machine learning models and reporting UIs, operators use an advanced AI Builder environment to orchestrate agents visually.
1. Instant Connection Setup
The transition to true visual analytics automation begins in the Connectors & Data Sources interface. Instead of writing complex connection pooling layers, setting up external middleware, or managing raw credentials inside code bases, engineers connect directly to live infrastructure with a single click.
WPIntelliChat provides production-ready, native connectors for structured systems including PostgreSQL, MySQL, and Snowflake, alongside dedicated interfaces for unstructured knowledge repositories. Because the platform natively understands the schemas of these connected data systems, it allows autonomous software agents to inspect metadata tables and formulate precise SQL or natural language queries in real time, bypassing the need for static semantic middleware.
2. Designing the Visual Workflow Canvas
Once the data environment is live, developers build automated intelligence tracks using the visual workflow panel. By placing functional processing blocks onto an interactive grid, teams construct a resilient directed acyclic graph (DAG) that connects raw ingestion points straight to executive-ready interfaces.
The Trigger Stage: Workflows are initialized automatically based on operational conditions. Engineers drop a Threshold Alert node to respond to specific database anomalies, or an On File Upload / Manual File Upload trigger node to parse incoming documentation immediately upon arrival.
The Intelligent Processing Loop: Once triggered, raw data moves sequentially through semantic nodes. The asset is routed into an automated RAG Query block to pull relevant internal context, company policies, or historical documentation from unstructured files. This enriched dataset passes directly to an execution-focused Ask AI node, which processes complex metrics and validates data trends without manual scripting.
The Visual Output and Forecasting: The final segment of the canvas transforms processed insights into interactive visual layers. By routing the output into a Generate Dashboard block paired with an AI-driven Forecast node, the platform synthesizes data trends and displays real-time predictive models instantly, eliminating the manual effort of rebuilding static dashboards.
Technical Architecture Note: By managing data processing through self-healing visual nodes, the analytics stack remains highly flexible. If an underlying database schema updates, the platform's internal agent recalculates the query parameters automatically, preserving downstream functionality without developer intervention.
Eliminate Pipeline Fragility Instantly
Stop writing brittle orchestration code. Sign up for WPIntelliChat to visually automate your data analytics pipeline in minutes.
Asymmetric Architecture: Legacy BI vs. WPIntelliChat Agentic AI
Securing Autonomous Intelligence with Enterprise Governance
Deploying agentic AI analytics across production databases requires strict corporate safety frameworks. Without real-time compliance validation, autonomous data processing loops risk introducing analytical hallucinations or unauthorized data exposures into critical operations.
To address this challenge, WPIntelliChat embeds an enterprise-grade LLM Governance system directly into its processing layer. Every query generated by an autonomous workflow is audited prior to external delivery:
The Enterprise Compliance Framework
Real-Time Automated Evaluation: The platform evaluates every automated asset through specific compliance metrics, calculating structural values for relevance, contextual coherence, and prompt completeness.
Centralized Administrative Controls: If a data generation falls below established corporate safety or quality metrics, the workflow is paused automatically, protecting teams from inaccurate reporting.
The Human Approval Queue: Flagged system prompts, workflow states, and agent profiles route into an administrative review dashboard. Authorized engineering leaders inspect execution costs, view telemetry data, and manually authorize assets before promoting them to active workspaces.
This balance between agentic automation and administrative control allows organizations to scale intelligent visual analytics safely, minimizing technical debt while giving non-technical teams direct access to high-fidelity data insights.
Deploying Next-Generation Data Solutions
The transition from brittle, code-heavy data pipelines to fully autonomous data analytics is an essential step for modern data architectures. By leveraging autonomous reasoning loops, enterprise teams eliminate recurring engineering bottlenecks, lower maintenance costs, and ensure decision-makers have access to real-time insights.
WPIntelliChat unites native multi-database connectors, visual workflow design, and enterprise-grade safety guardrails into a single, cohesive ecosystem.
Ready to transform your data operations? Launch your free WPIntelliChat instance to visually orchestrate your first autonomous data workspace, or connect with our engineering team to schedule a custom enterprise governance demonstration.